Sprint Burndown Chart
The Sprint Burndown Chart is a report that displays the amount of completed work compared to the ideal pace of task completion. The report only contains the data for the active sprint. Use that information to evaluate the efficiency of the team during the current sprint and make adjustments to the development process when necessary.
- If the ideal sprint burndown is above the actual one, the team handles the workload faster than planned.
- If the ideal sprint burndown is below the actual one, the team is behind the schedule and fails to handle the planned pace of task completion.
Roles required:
-
View report – admin, pda_admin, pda_user.
-
Report configuration – admin, pda_admin; pda_user, if they are:
- the project team member or leader;
- the owner of the product or product module specified in the project.
To open the sprint burndown chart, complete the following steps:
- Open the task board of a Scrum project that has an active sprint.
- Click the icon located in the upper right corner of the board next to the action menu. You will be redirected to the page of the current sprint's burndown chart.
The report header shows the title of the project to which the sprint belongs. The following actions are available to you in the report:
-
Refresh – click to refresh the report data.
-
Open board – click to return to the project board.
-
Configure report – click to open the report configuration modal window:
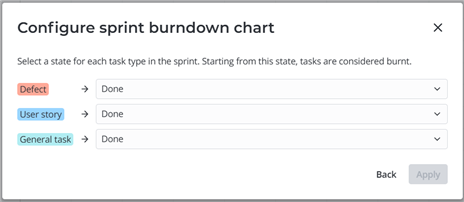
In this window, specify the state that indicates a task is burnt. You can do this for each third-level task type in the project that is also in the current sprint. You can select from the states included in the state models of those task types in the current project. If the state model in the project record is not created for a task type, all states are available. Click Apply to save the configuration and refresh the report.
Next to the UI actions, you can see the current sprint title (click it to open the sprint record) and the start and end dates of the sprint.
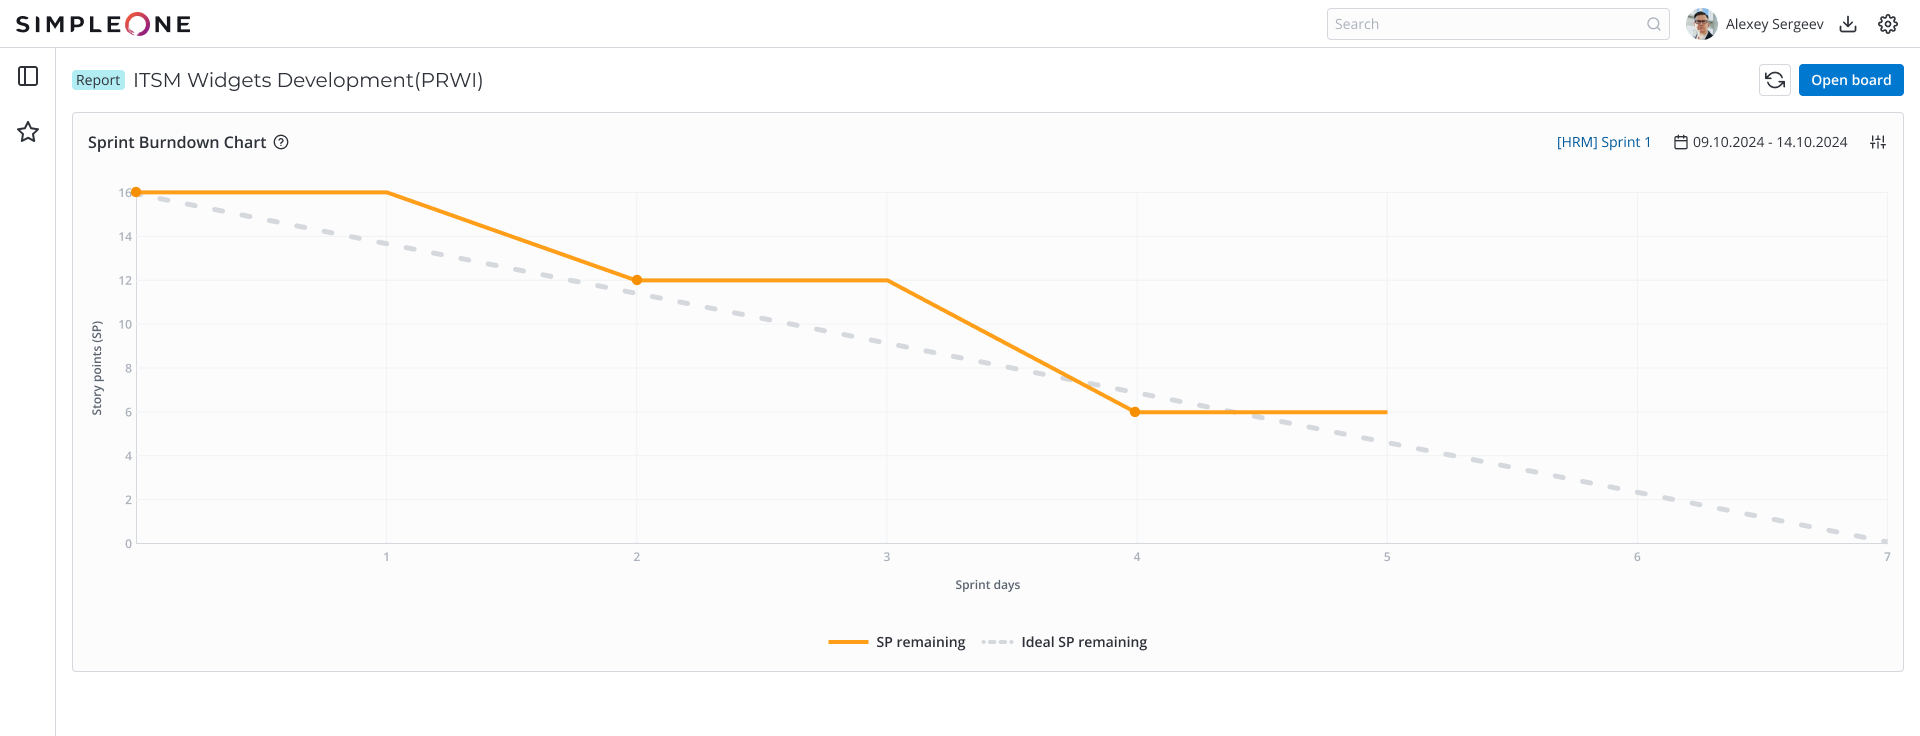
The chart consists of two axes:
- Story points (SP) – the overall number of story points in the sprint tasks. The report includes only third-level tasks of the current sprint in all states except for New. Canceled tasks are not included. If the number of story points is not specified for a task, it is not included either. The actual sprint burndown line descends on this axis as the tasks are burnt.
- Sprint days – the number of days from the start till the end of the sprint. The actual burndown line moves forward on this axis at the end of each work day. If the sprint has expired, the actual burndown line continues up to the current day, and the ideal burndown line stops at the sprint end date. To fix this and extend the ideal burndown line, change the sprint end date to a later one.
The dotted line shows the ideal sprint burndown (steady completion of tasks throughout the sprint). The orange line shows the actual sprint burndown.
The first dot on the actual burndown line marks the sprint start date. Move the pointer over it to see the overall number of story points and tasks in the sprint:

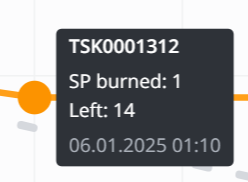
Other dots represent the movement of tasks into the burnt state on a given day. Move the pointer over a dot to see the following:
- Task number
- The number of burned story points
- The number of remaining story points in the sprint
- The date and time of task completion
If the sprint has tasks for which the number of story points is not specified or equals zero, their burning will not be displayed on the chart and will not affect the data. The chart will display a corresponding badge indicating the presence of such tasks. Click it to open the list of uncanceled sprint tasks with the Story points field value empty or equal to zero.
![]()
To make the report representative of the team's efficiency in the current sprint, ensure that all tasks are assigned story points.
When an active sprint is completed, the chart becomes unavailable until the next sprint is started. The chart only displays information for the sprint that is active at any given time.